Inflation perceptions
How good (bad) are we at assessing inflation?
Recently I came across a very interesting dataset: the CES (Consumer Expectations Survey). It has a lot of data points for analysis, although the time frame is a bit short for now, only after 2020. But still it is a survey that gives us a lot of information:
- what people expect the inflation rates to be in the future,
- what they estimate they were in the past,
- their trust in organizations in the EU,
- their financial literacy etc.
I thought that I would try to find some insights and present them in a nice coherent way. The ECB has some insights and graphs, but none of them actually focused on the accuracy of people’s perception, but more on the trends. I guess claiming that people are really bad at this and publishing some reports on their website wouldn’t be the best PR move ever.
But I was interested, so I added actual inflation data to the dataset and made some interesting graphs. Well at least they seemed interesting at the time. As of writing this, it’s not nearly as cool as I thought this would be. But, you live and you learn. It’s my first blog post ever, I’ll try to step it up in the future.
To answer the question from the subtitle - How good are we at assessing inflation? Spoiler alert: Pretty bad. But let’s look at the data to make sure.
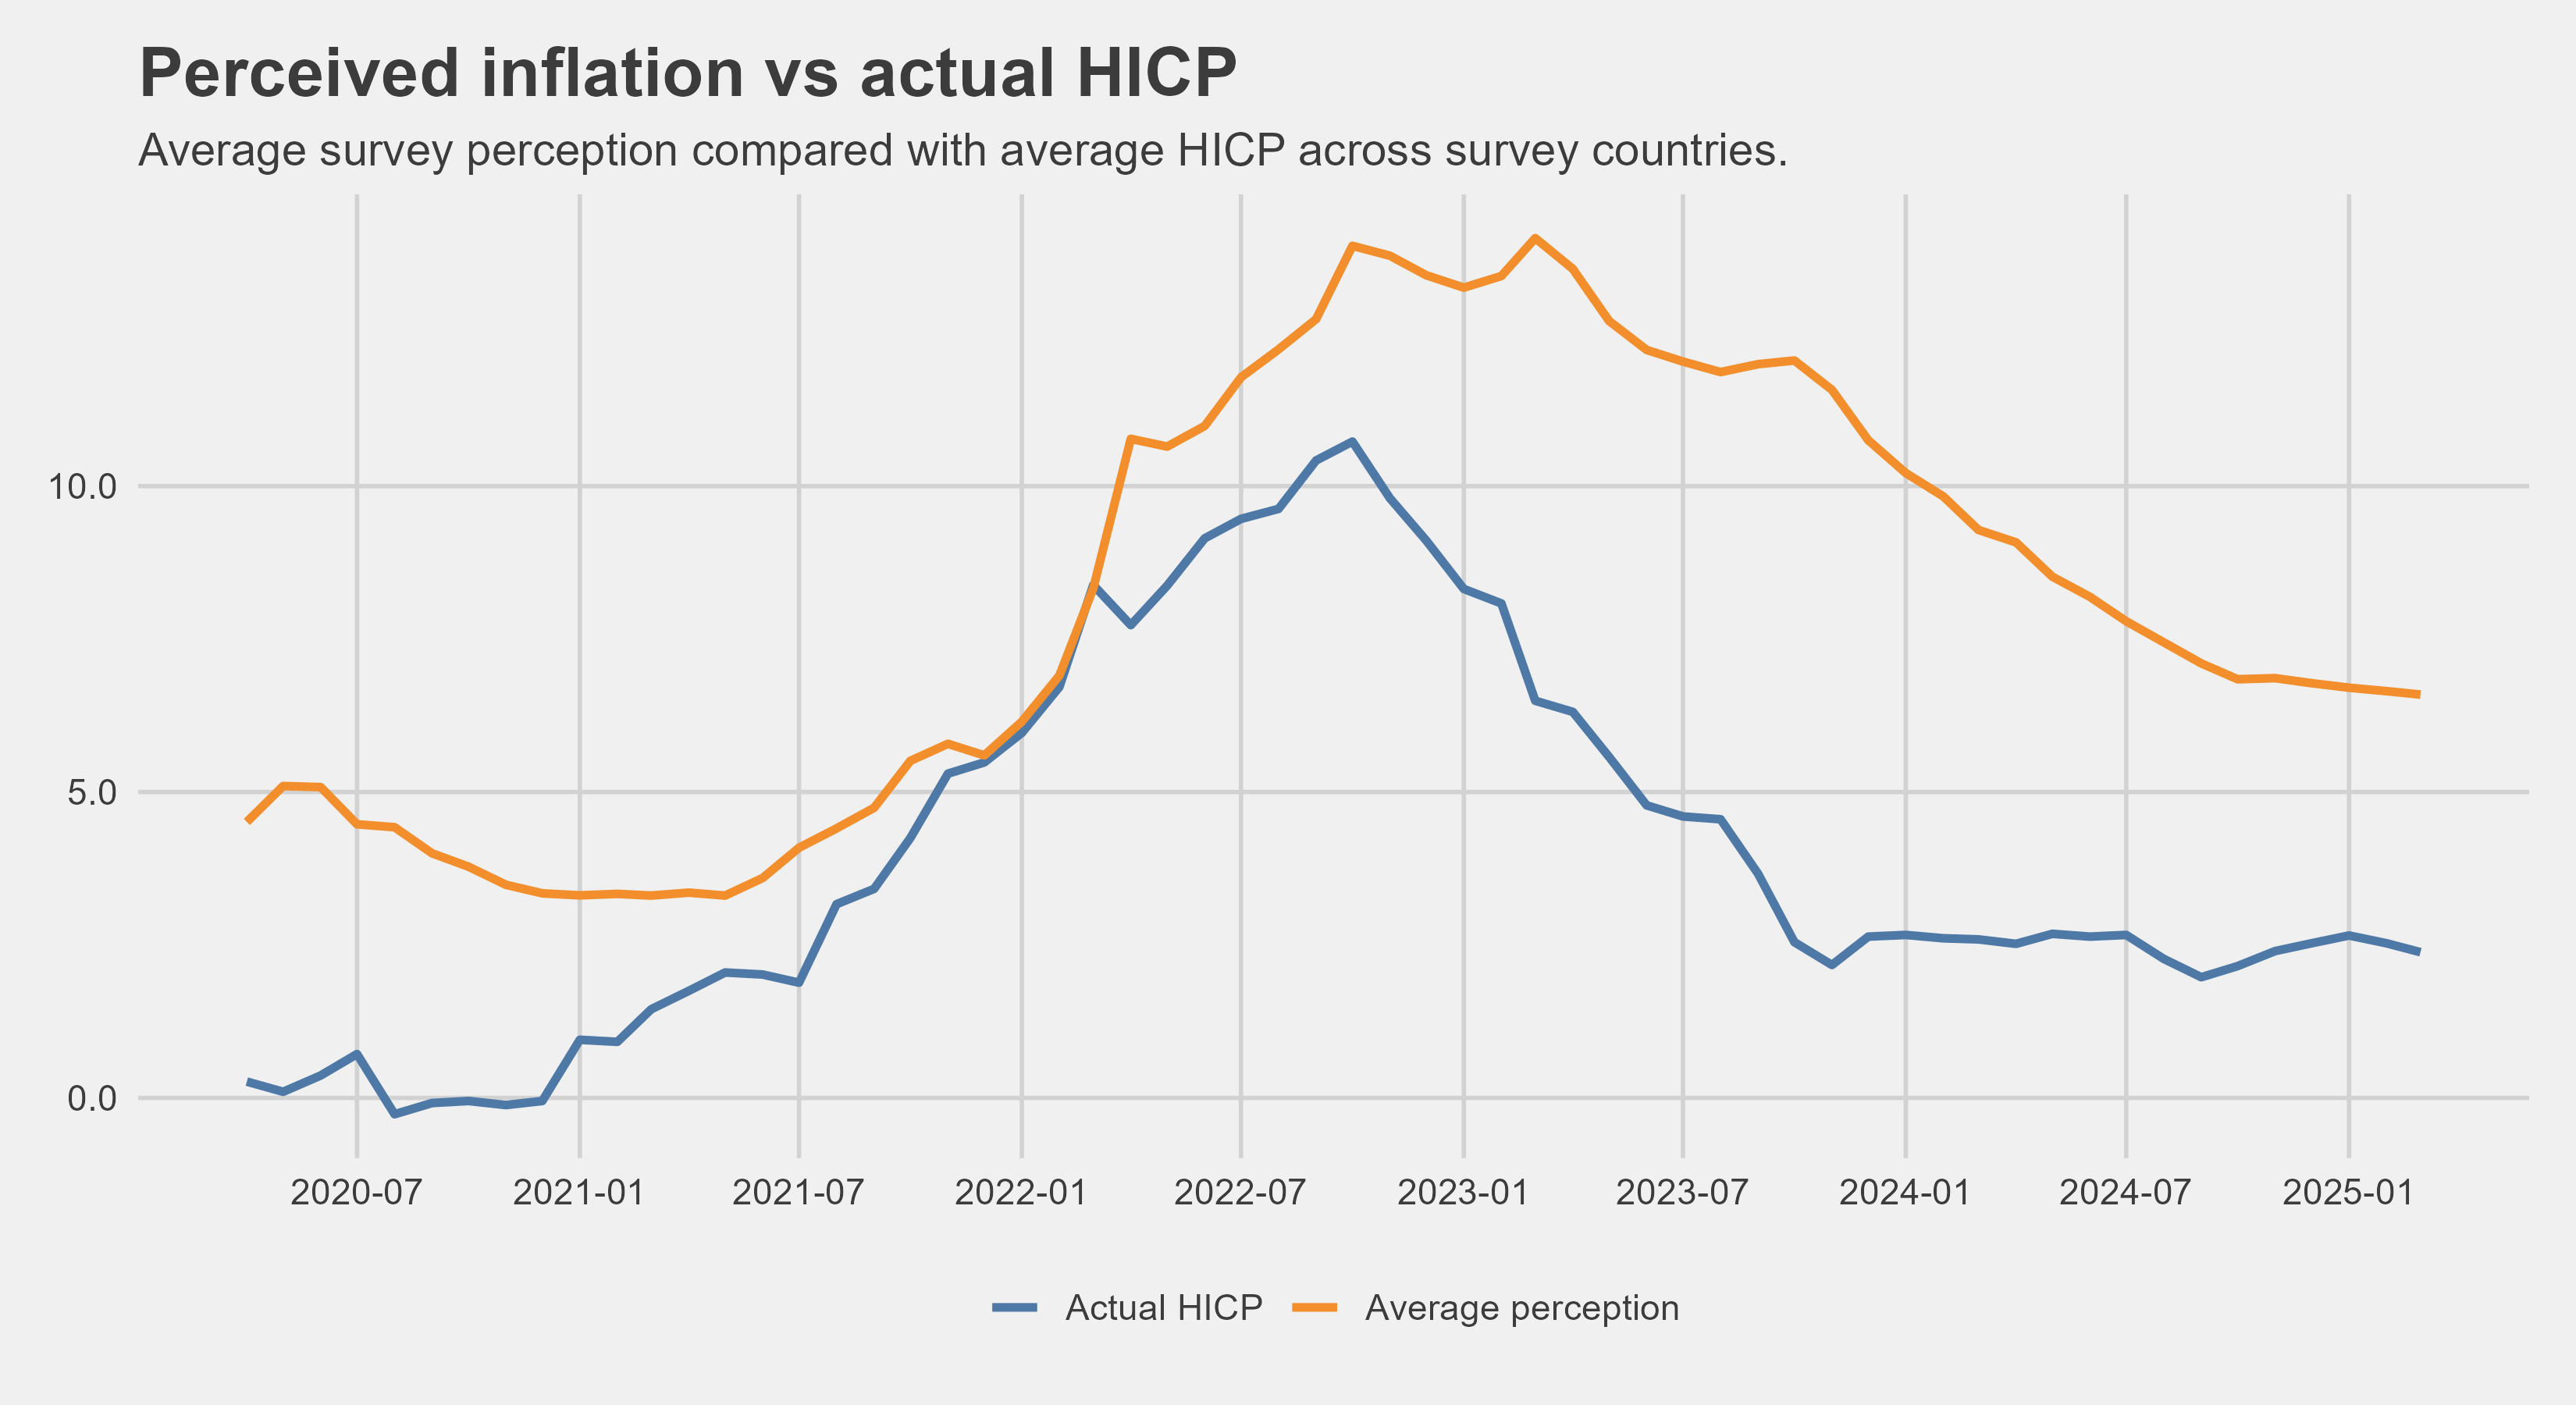
So this is quite telling, but I saw some other breakdowns of the data that I could do, so I decided to break the percieved inflations down by age.
Inflation perception across age groups
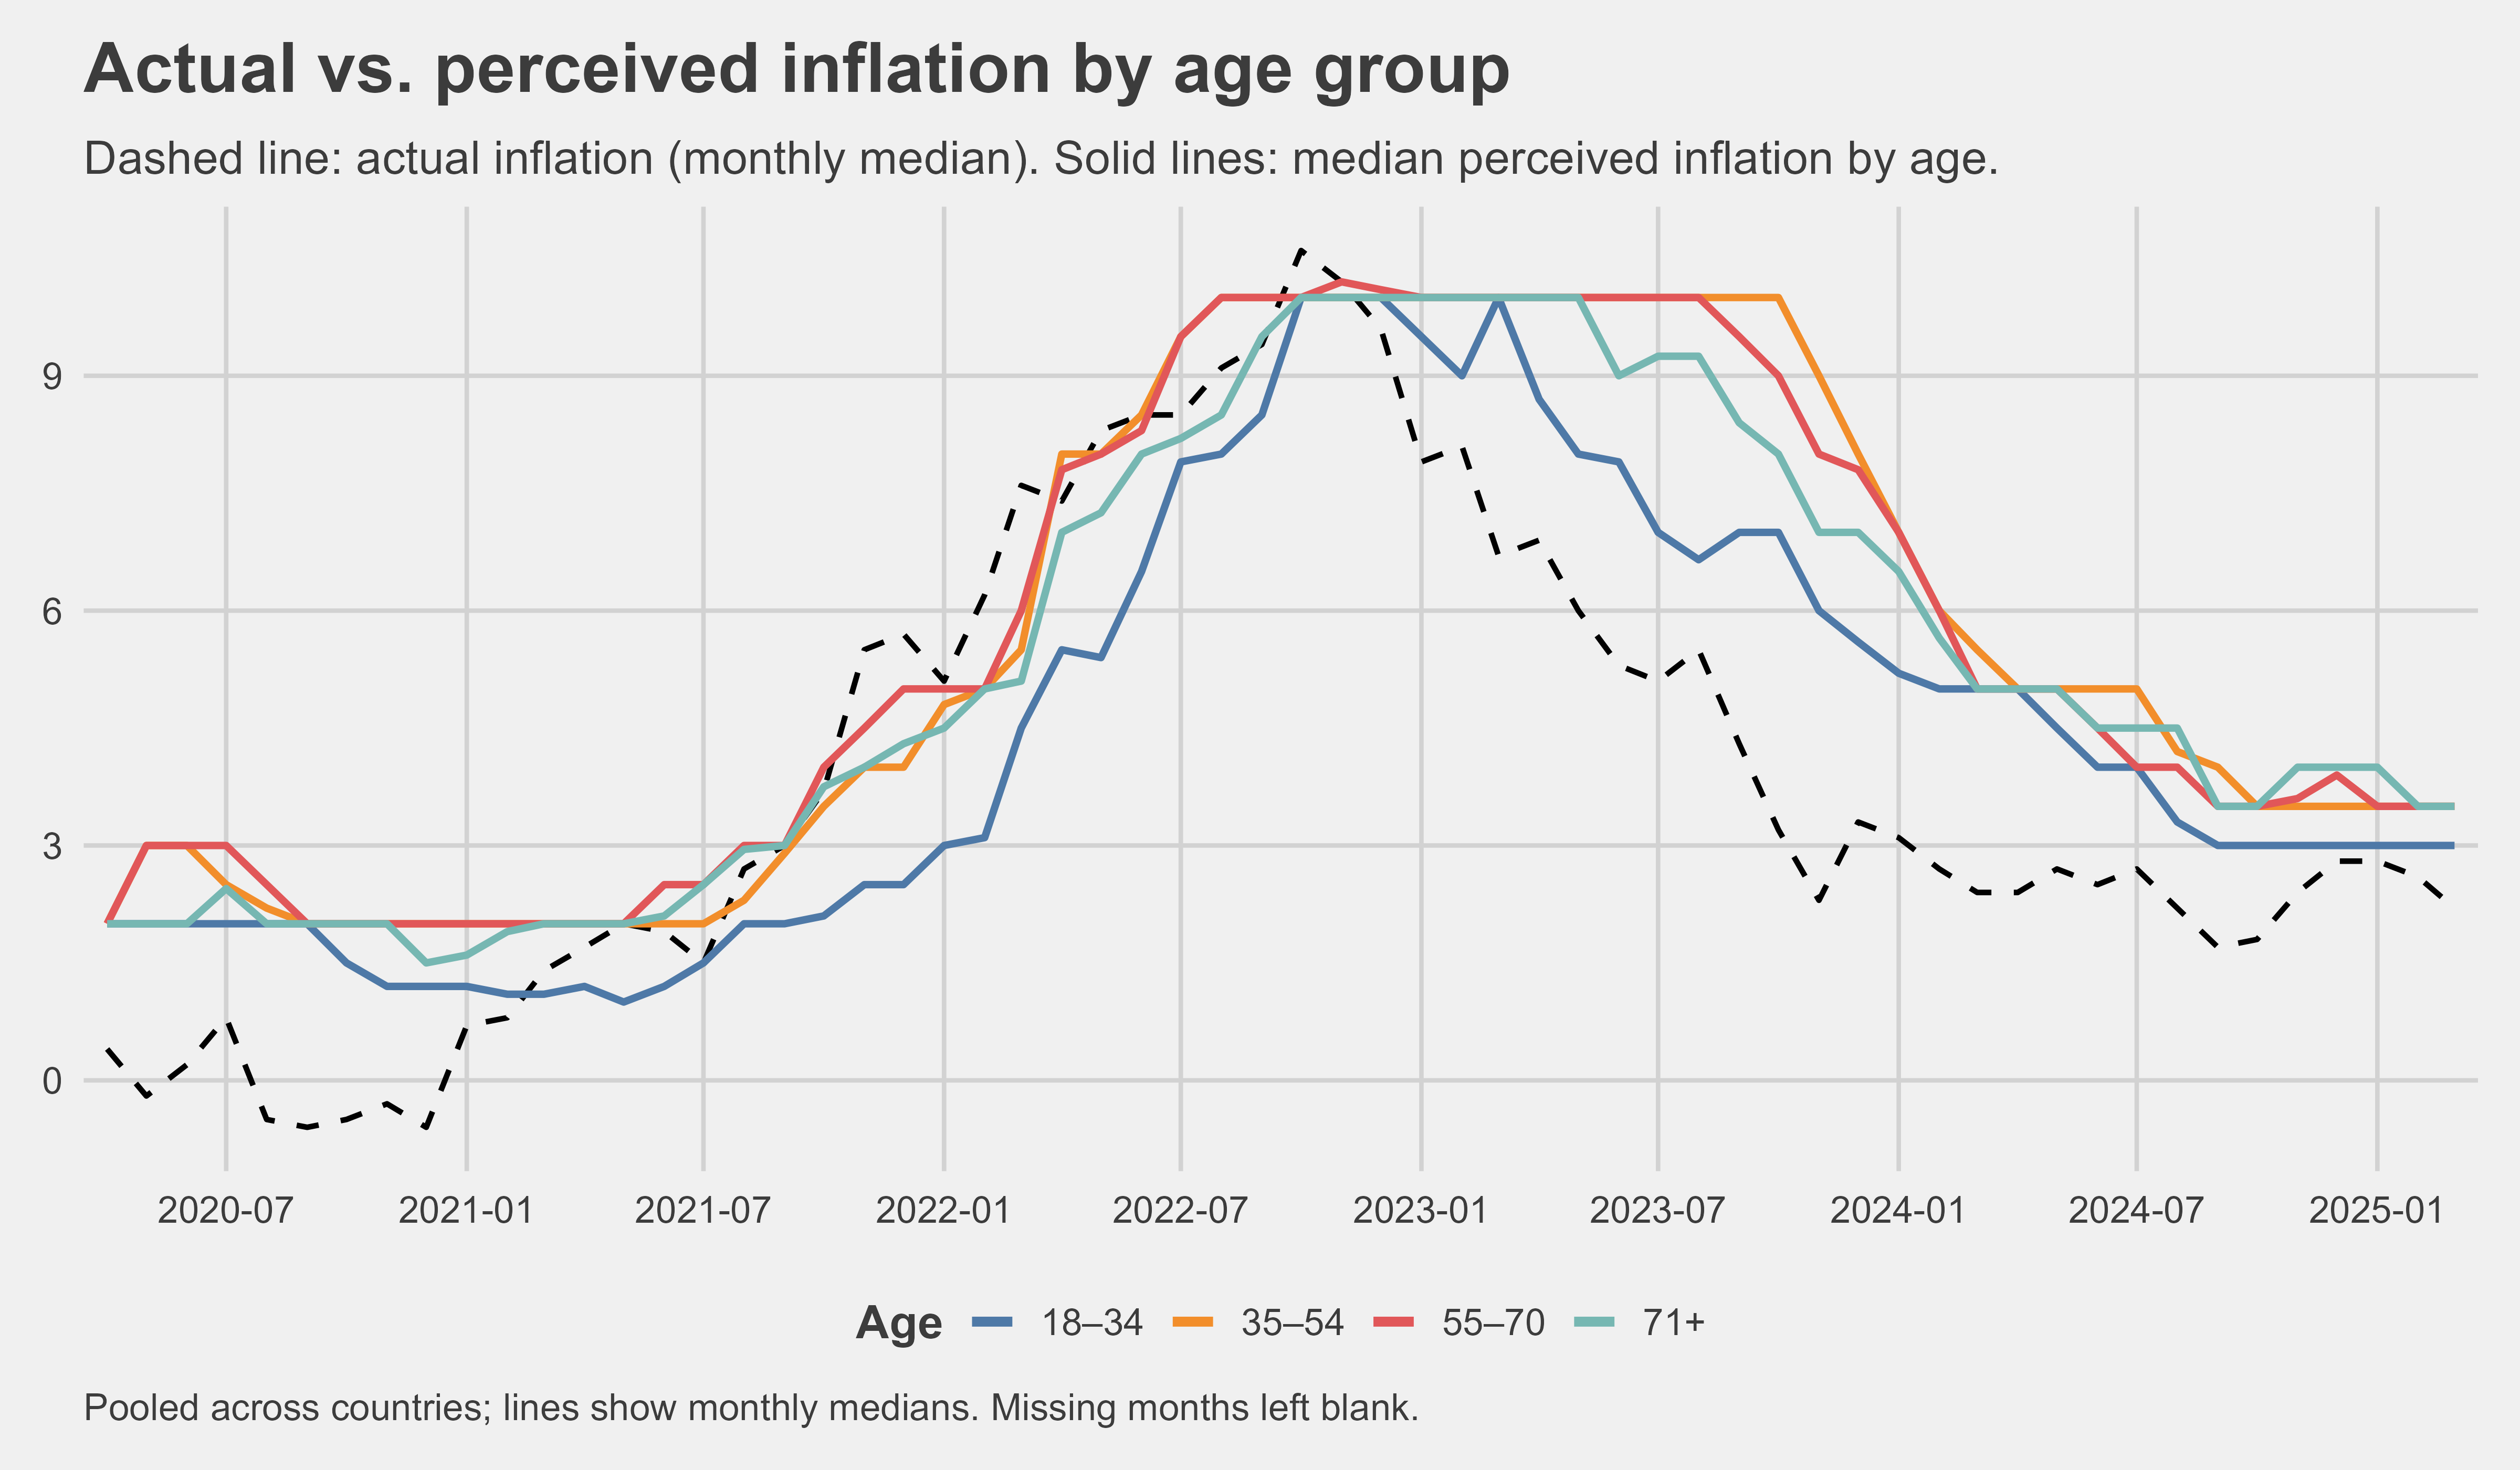 quick comment about the median values here: we can see that between 2023 and 2024 some lines are always at 10% - this is because the survey asks for a number and a big group of people just pick 10 percent - it is not an error, despite the weird look
The percieved inflation stayed much higher for much longer than actual inflation. For 35-54 year olds for example, percieved inflation fell below 10% around december 2023, even though that actual reported inflation fell below 10% approximately a year earlier.
It looks like younger people notice inflation later, but notice decrease of inflation sooner. Quite curious. But what is interesting that percieved inflation rarely, if ever goes below 2%. People don’t notice prices decreasing, but they see prices increasing quite quickly.
Here is the data in table form showing the median error of survey respondents. Younger people seem to be worse at inflation estimates for the past. But there seems to be a quite consistent trend of overestimating by about 2 percentage points in stabler times and even more in uncertain (high inflation) times. I looked into this in the smaller table beneath this one, in which I excluded the most irregular two years.
Table of median absolute error (percieved - actual inflation)
| Age group | 2020 | 2021 | 2022 | 2023 | 2024 | 2025 | Total |
|---|---|---|---|---|---|---|---|
| 18–34 | 2.2 | 2.4 | 5.4 | 5.4 | 3.1 | 2.4 | 3.7 |
| 35–54 | 2.6 | 2.1 | 4.5 | 6.0 | 3.4 | 2.2 | 3.7 |
| 55–70 | 2.6 | 1.7 | 3.3 | 5.5 | 3.0 | 2.0 | 3.1 |
| 71+ | 2.0 | 1.7 | 3.0 | 4.7 | 2.7 | 1.8 | 2.8 |
| All groups | 2.5 | 2.1 | 4.2 | 5.7 | 3.2 | 2.1 |
Table with some years excluded
| Absolute error | All years | Without 2022 and 2023 |
|---|---|---|
| Mean | 7.2 | 5.8 |
| Median | 3.4 | 2.6 |
But the argument to be made here is that people mostly develop their perception of inflation based on cost of goods and services - and inflation of those did in fact lag behind HICP inflation. The main cause of inflation was the cost of energy, which spiked up dramatically in 2022, but then also fell quite rapidly after many governments started to intervene.
So in order to observe that more closely, I prepared the next section as well
Which expenses affect people’s perceptions the most?
So this may be very obvious and you will probably conclude that it’s food prices especially which affect our perceptions of inflations. The main reason behind this:
- we buy them often, so we know what the changes were - i.e. we have a lot of data points to observe
Peoples perceptions are skewed because food is not a significant expense for the average European - 13% of household expenditure based on this data. So we get a biased perspective on the price changes.
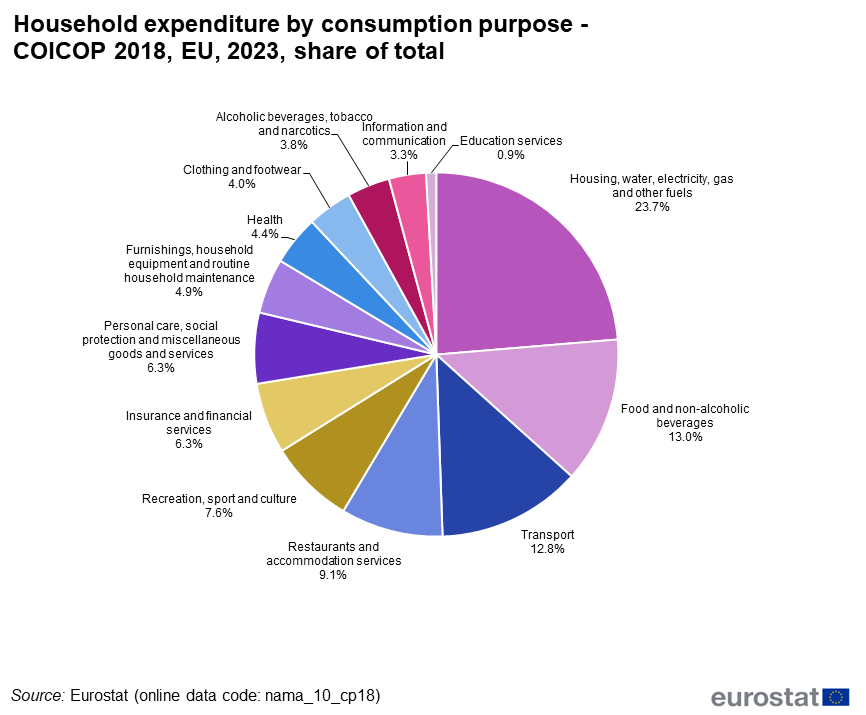
People therefore care too much about food prices, when in reality they are that big of an expense. I will show the breakdown of different inflation subsets and how different the reactions to changes in each are.
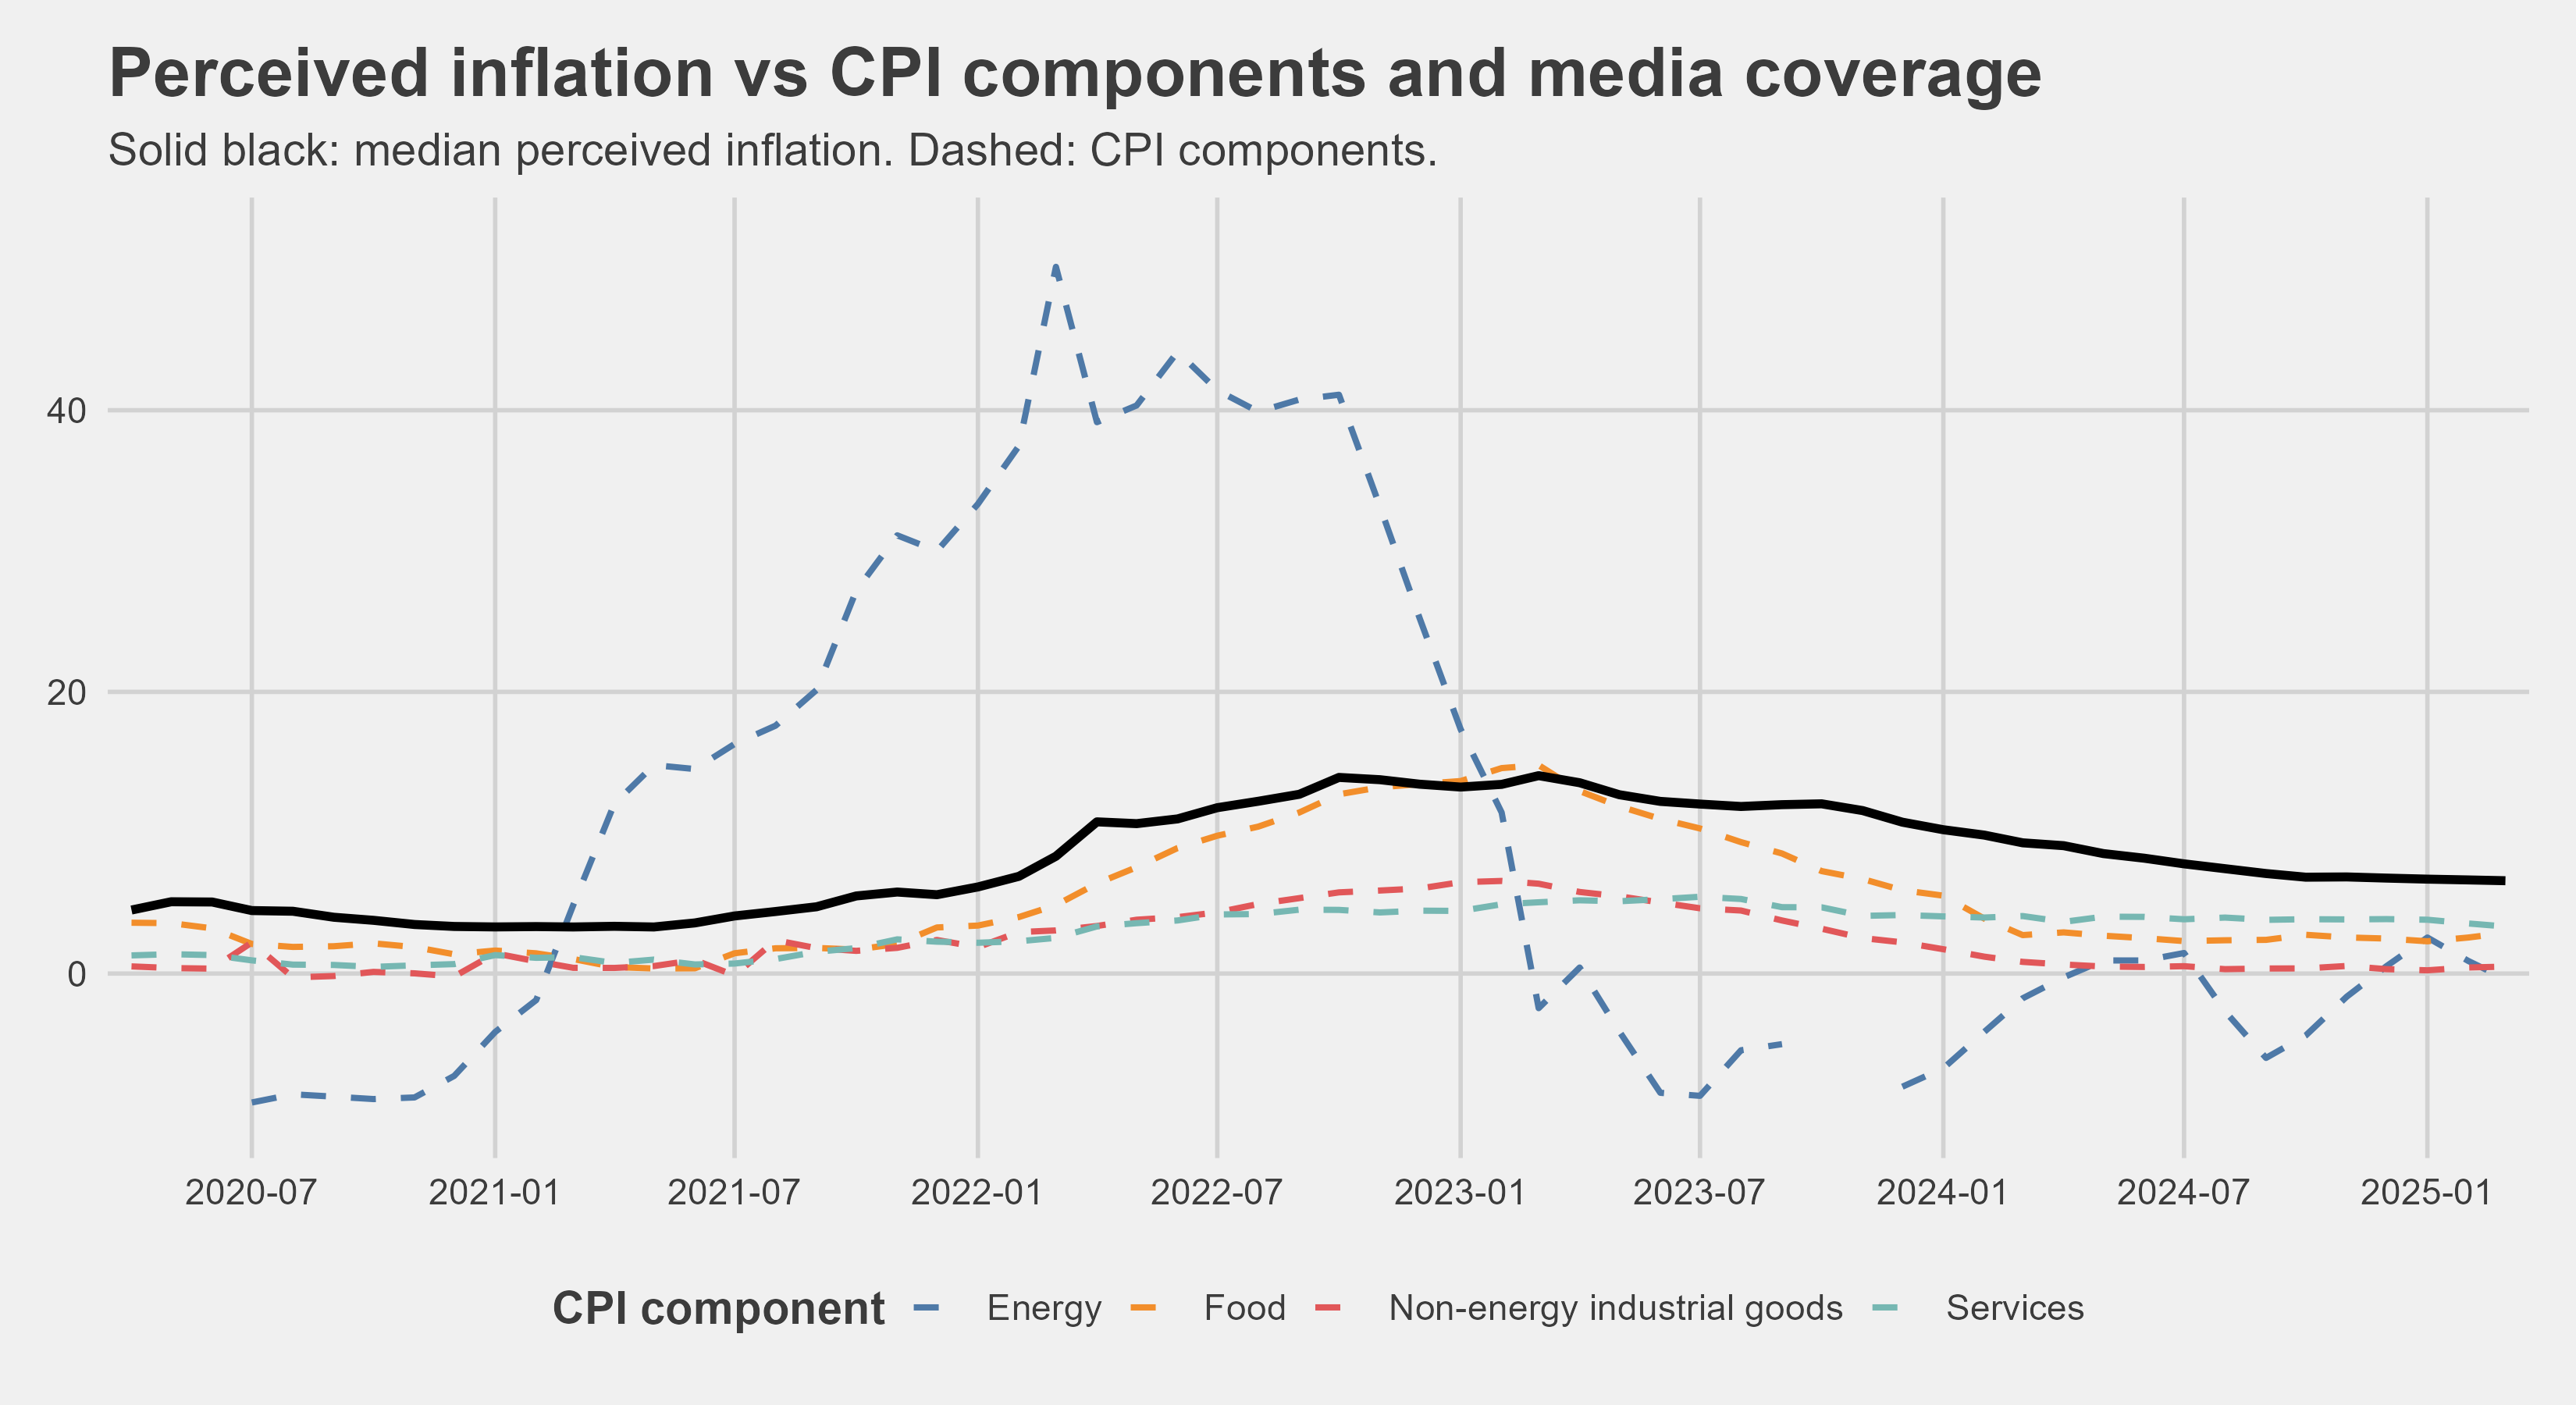
We can see that services don’t affect consumers’ perceptions much, neither do non-energy industrial goods (that is a given I suppose). But what is missing from the graph is energy and I will explain what the deal is with that shortly.
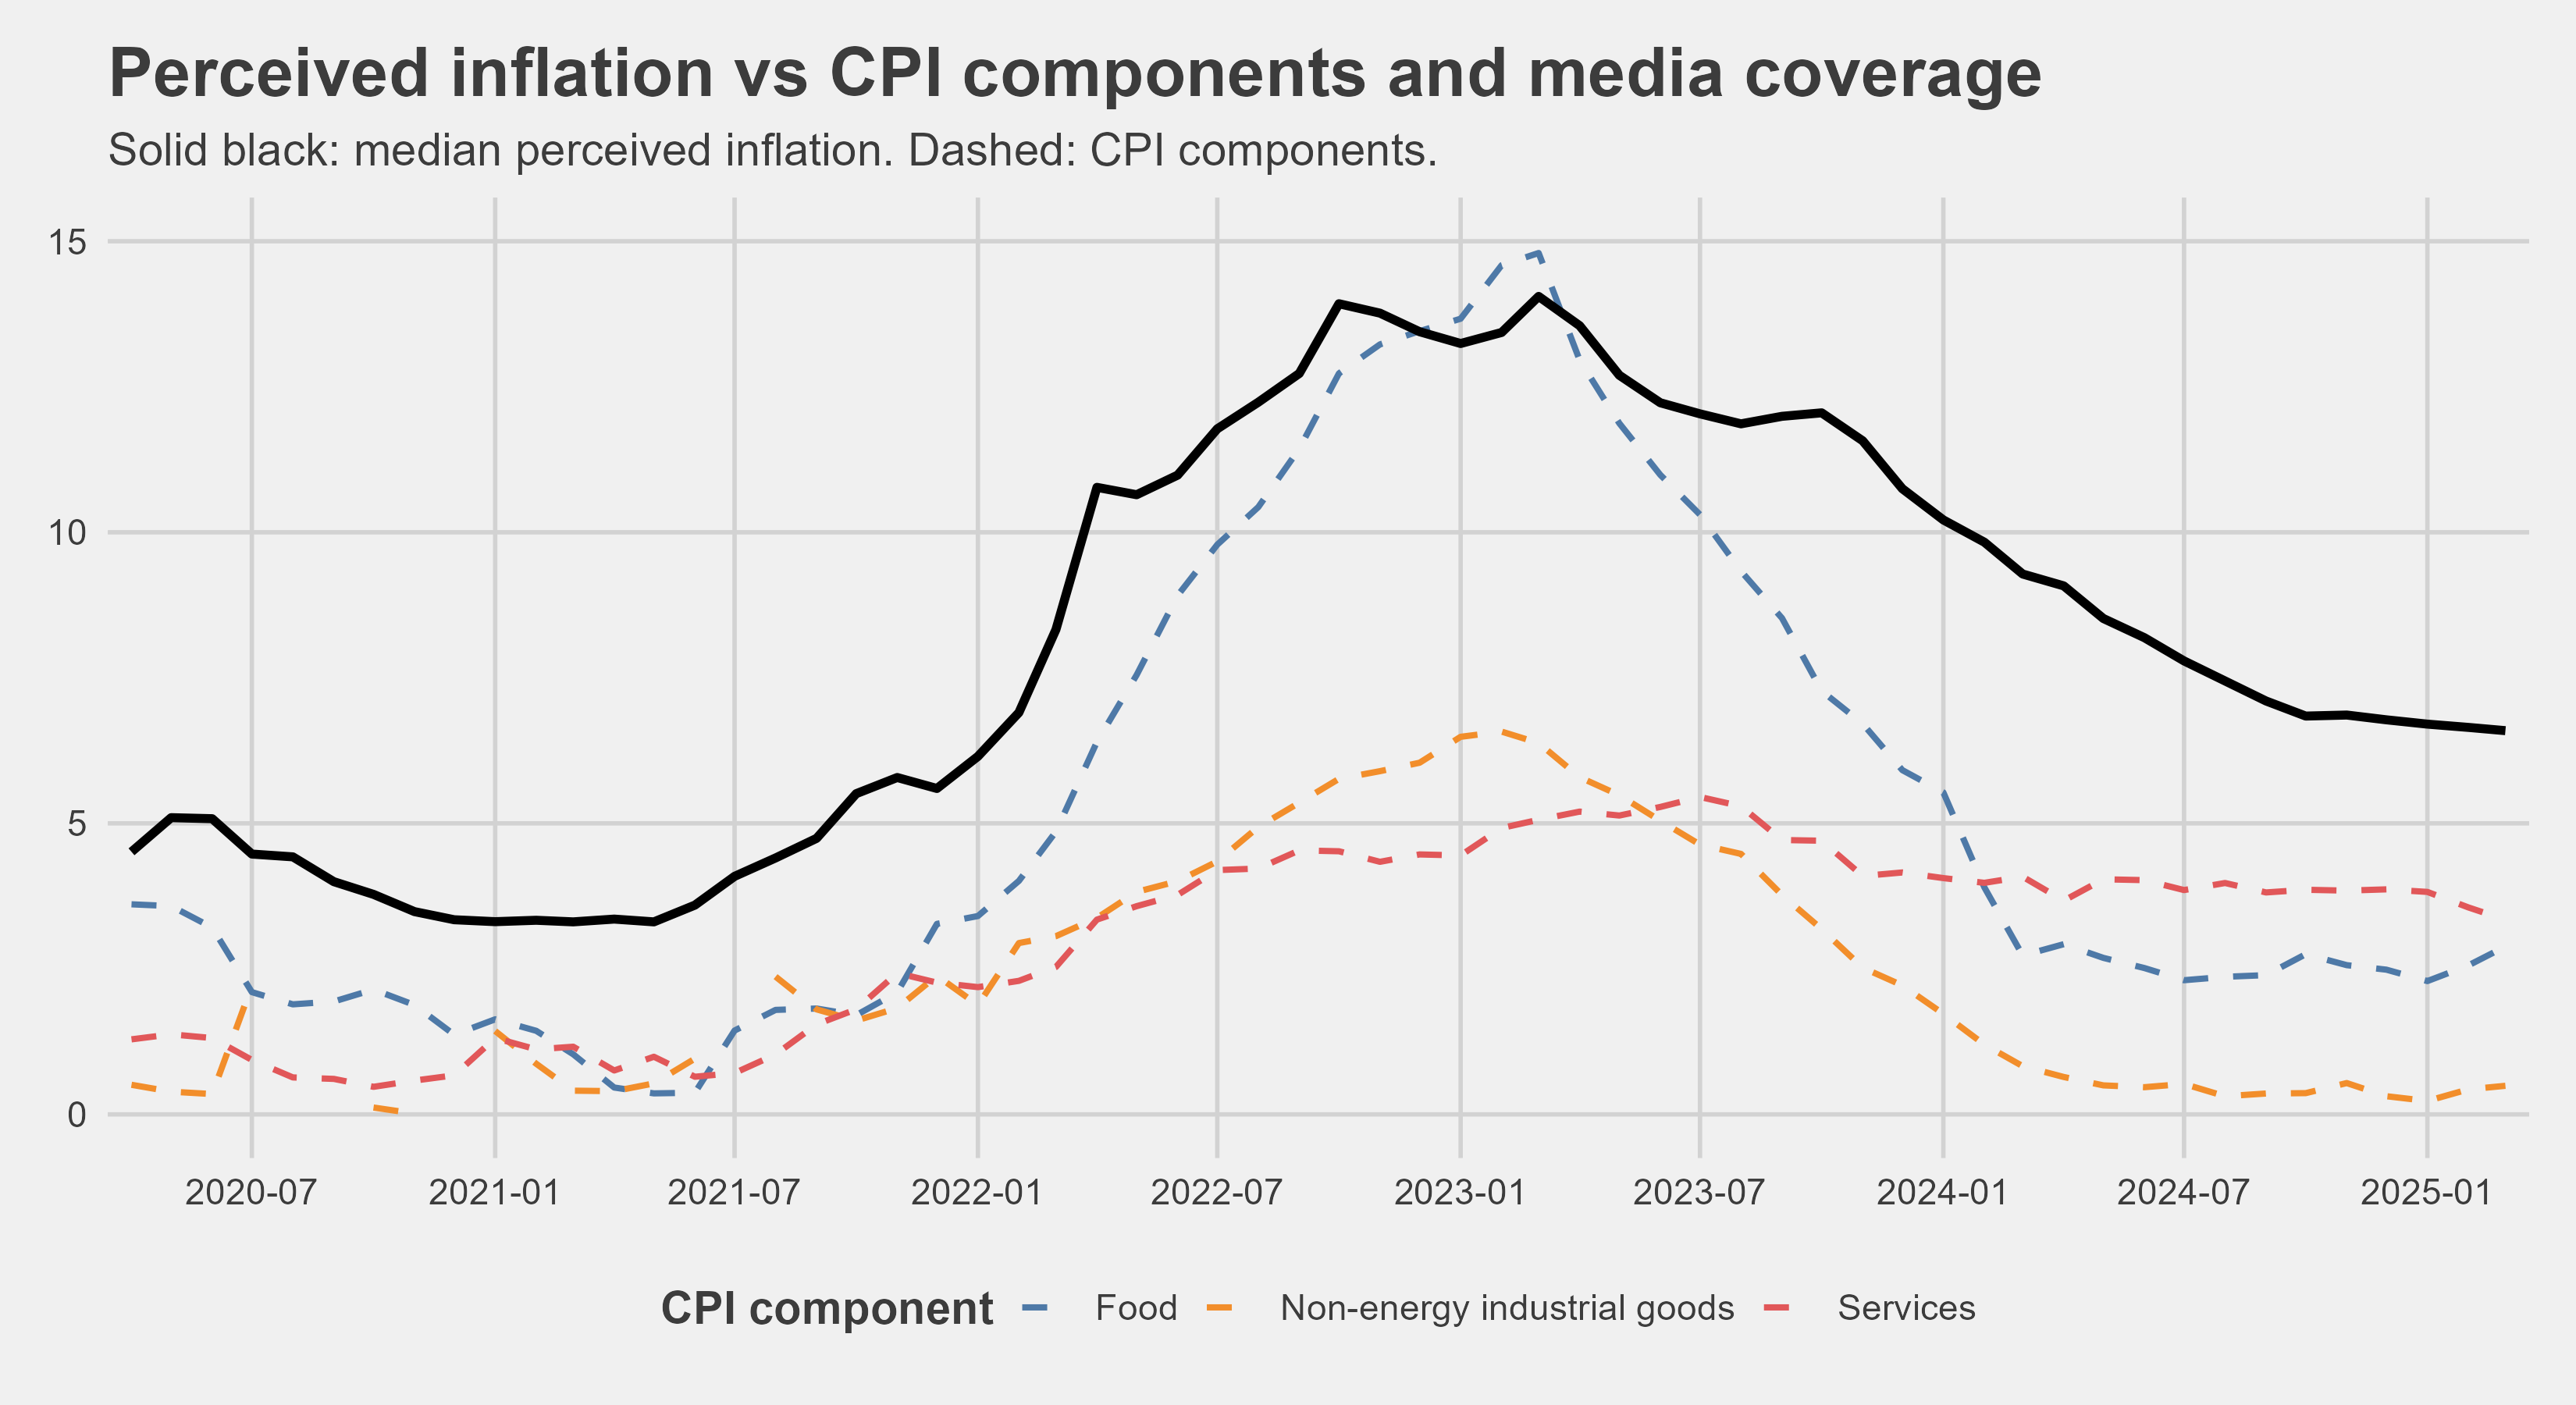
Energy prices are arguably the most important production input for many business, and will probably grow even more with time (the recent AI boom significantly increased electricity demands). And they have the most spillover effect on the prices of other goods - so they should be what we focus on.
This article for example states that the impact is about 60 percent, but it seems that people simply do not much care:
In this article, we evaluate the role of energy in driving inflation in the euro area since mid-2021 ... The contribution of these shocks to headline inflation is estimated to be around 60 per cent in the fourth quarter of 2022. There is also evidence of an increase in the pass-through of energy prices to euro-area core inflation as a consequence of this large unprecedented shock.
I purposefully left out energy out of the graph above. It makes the HICP inflation rates look minimal and the energy prices are the main reason for the inflation (well at least they were in this crisis, I should maybe research different causes further - some other time probably) and should guide our inflation perceptions.
Correlation of month-over-month changes with perceived inflation
| component | correlation |
|---|---|
| Food | 0.627 |
| Services | 0.428 |
| HICP | 0.263 |
| Nonind | 0.153 |
| Energy | -0.029 |
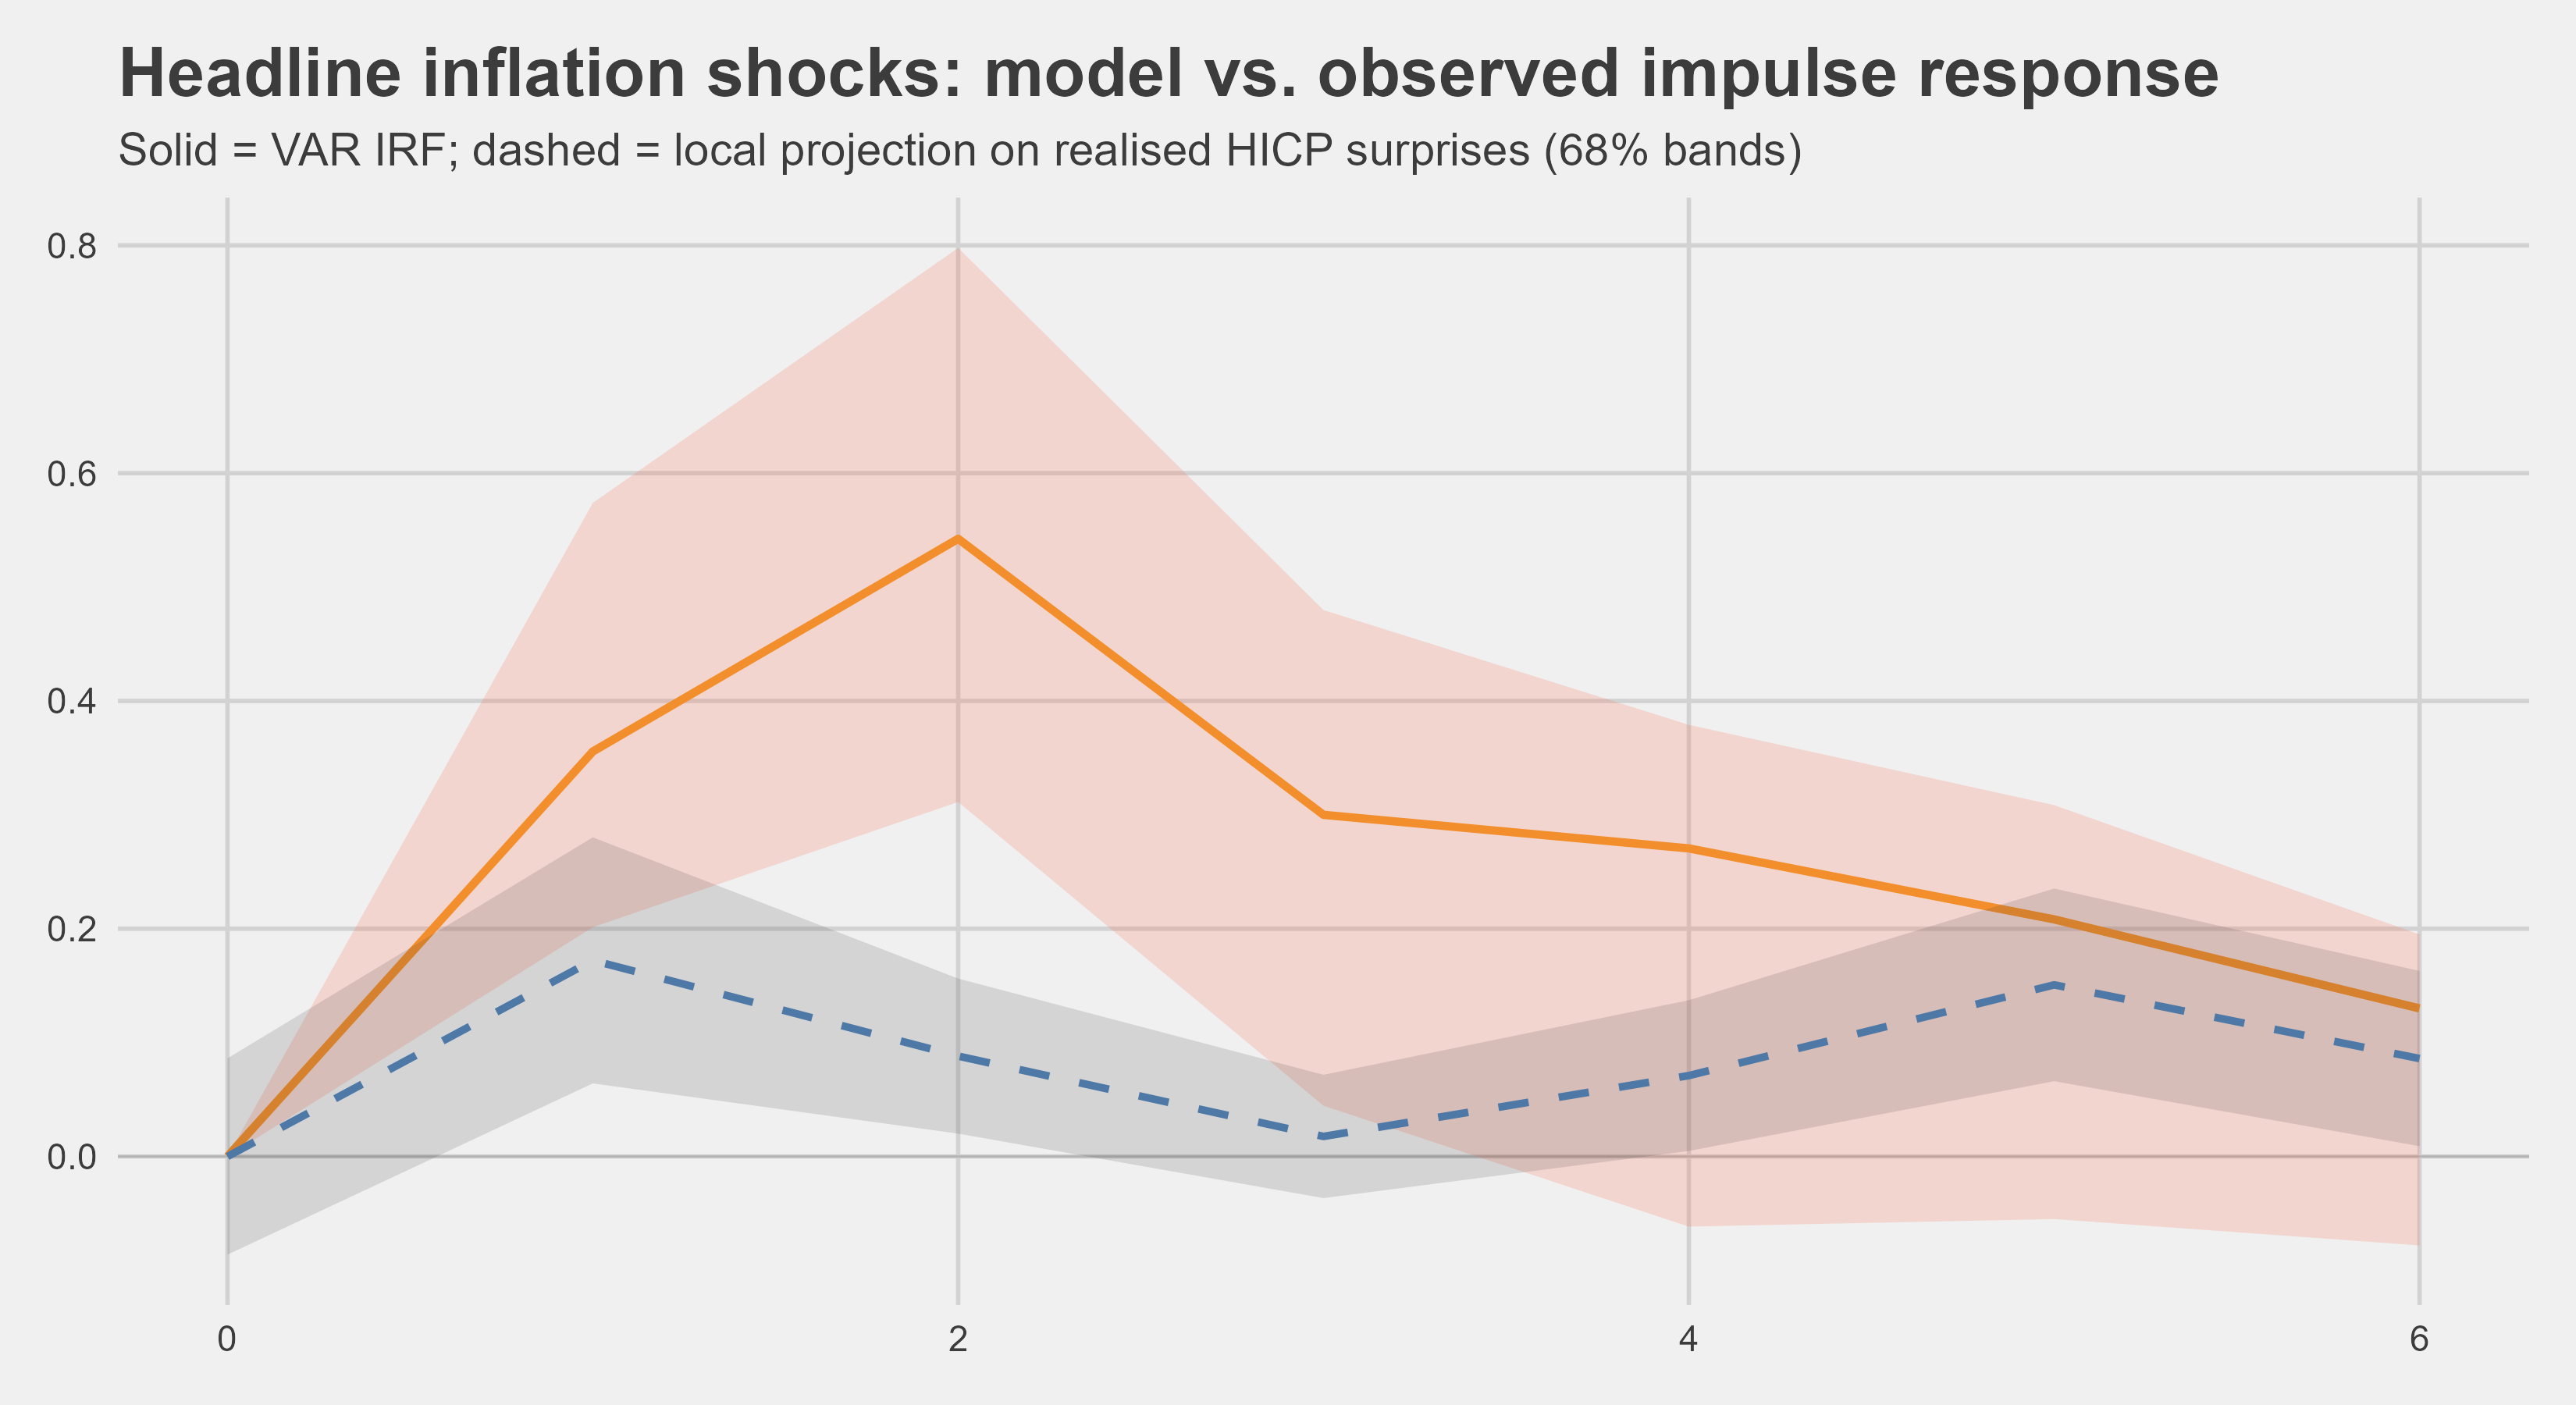
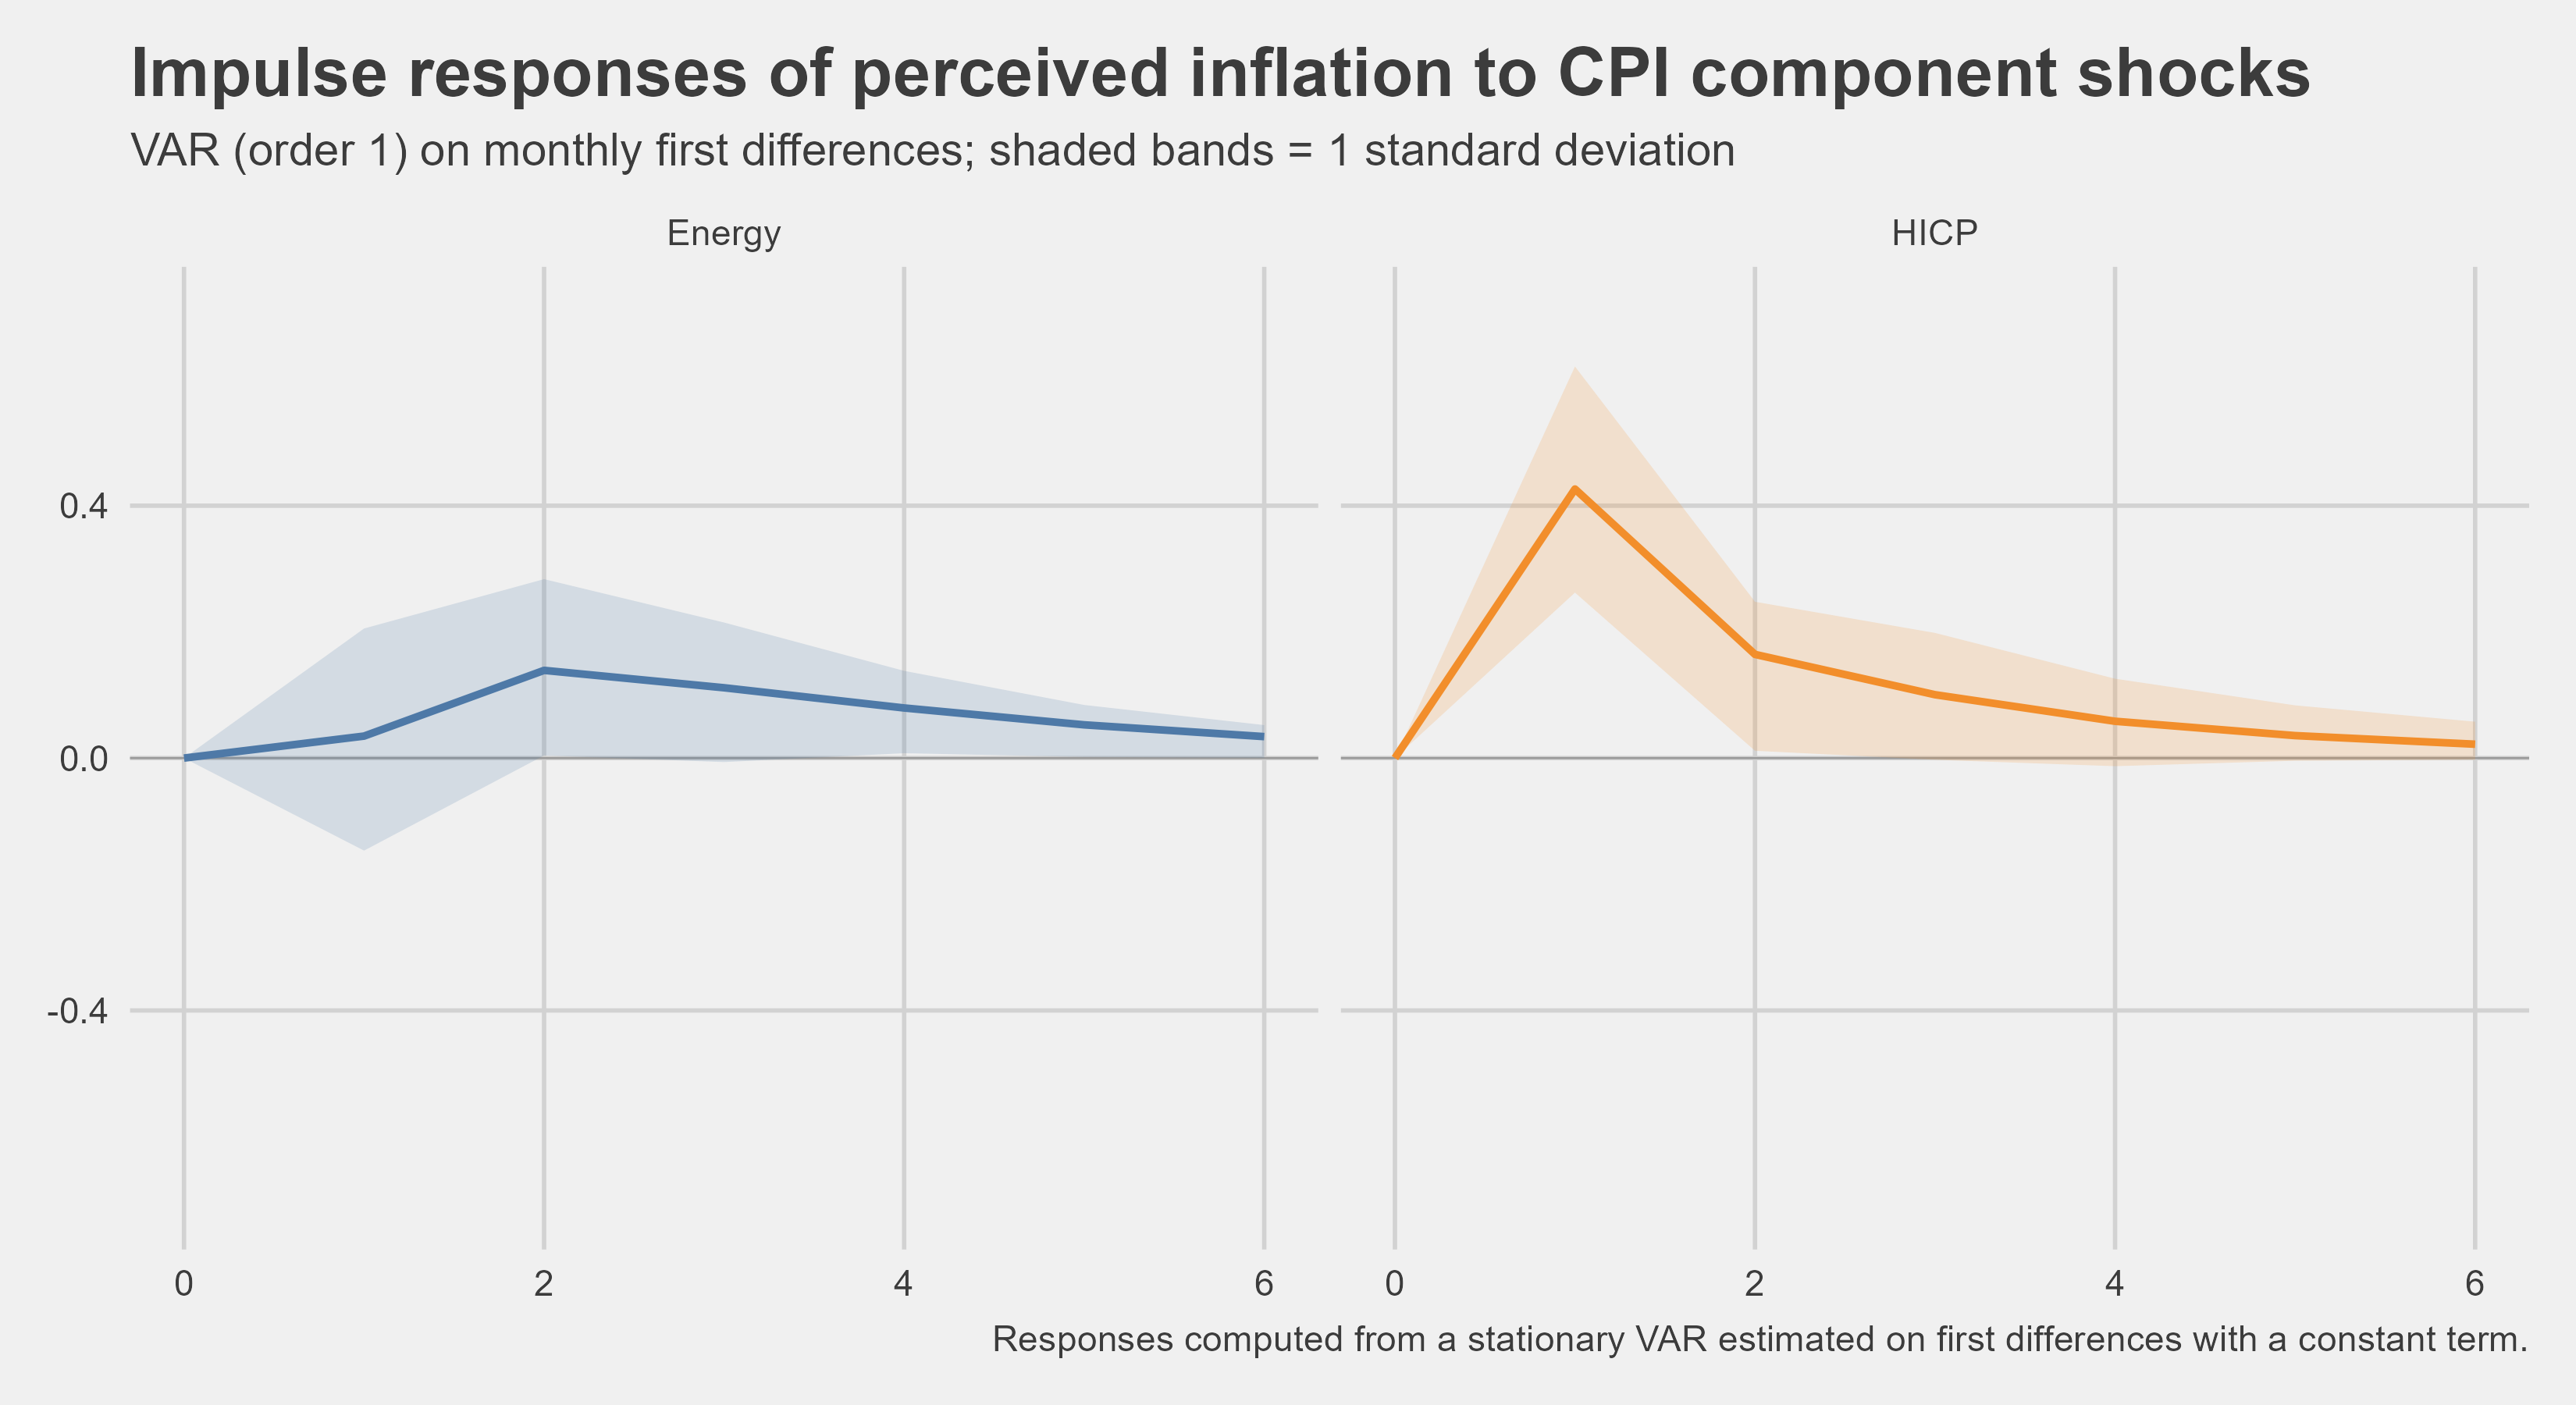
Just to nail the point home a bit more, I made a quick VAR model to test some impulse responses. This is showing changes to peoples perception if energy has shock and if HICP has a shock.
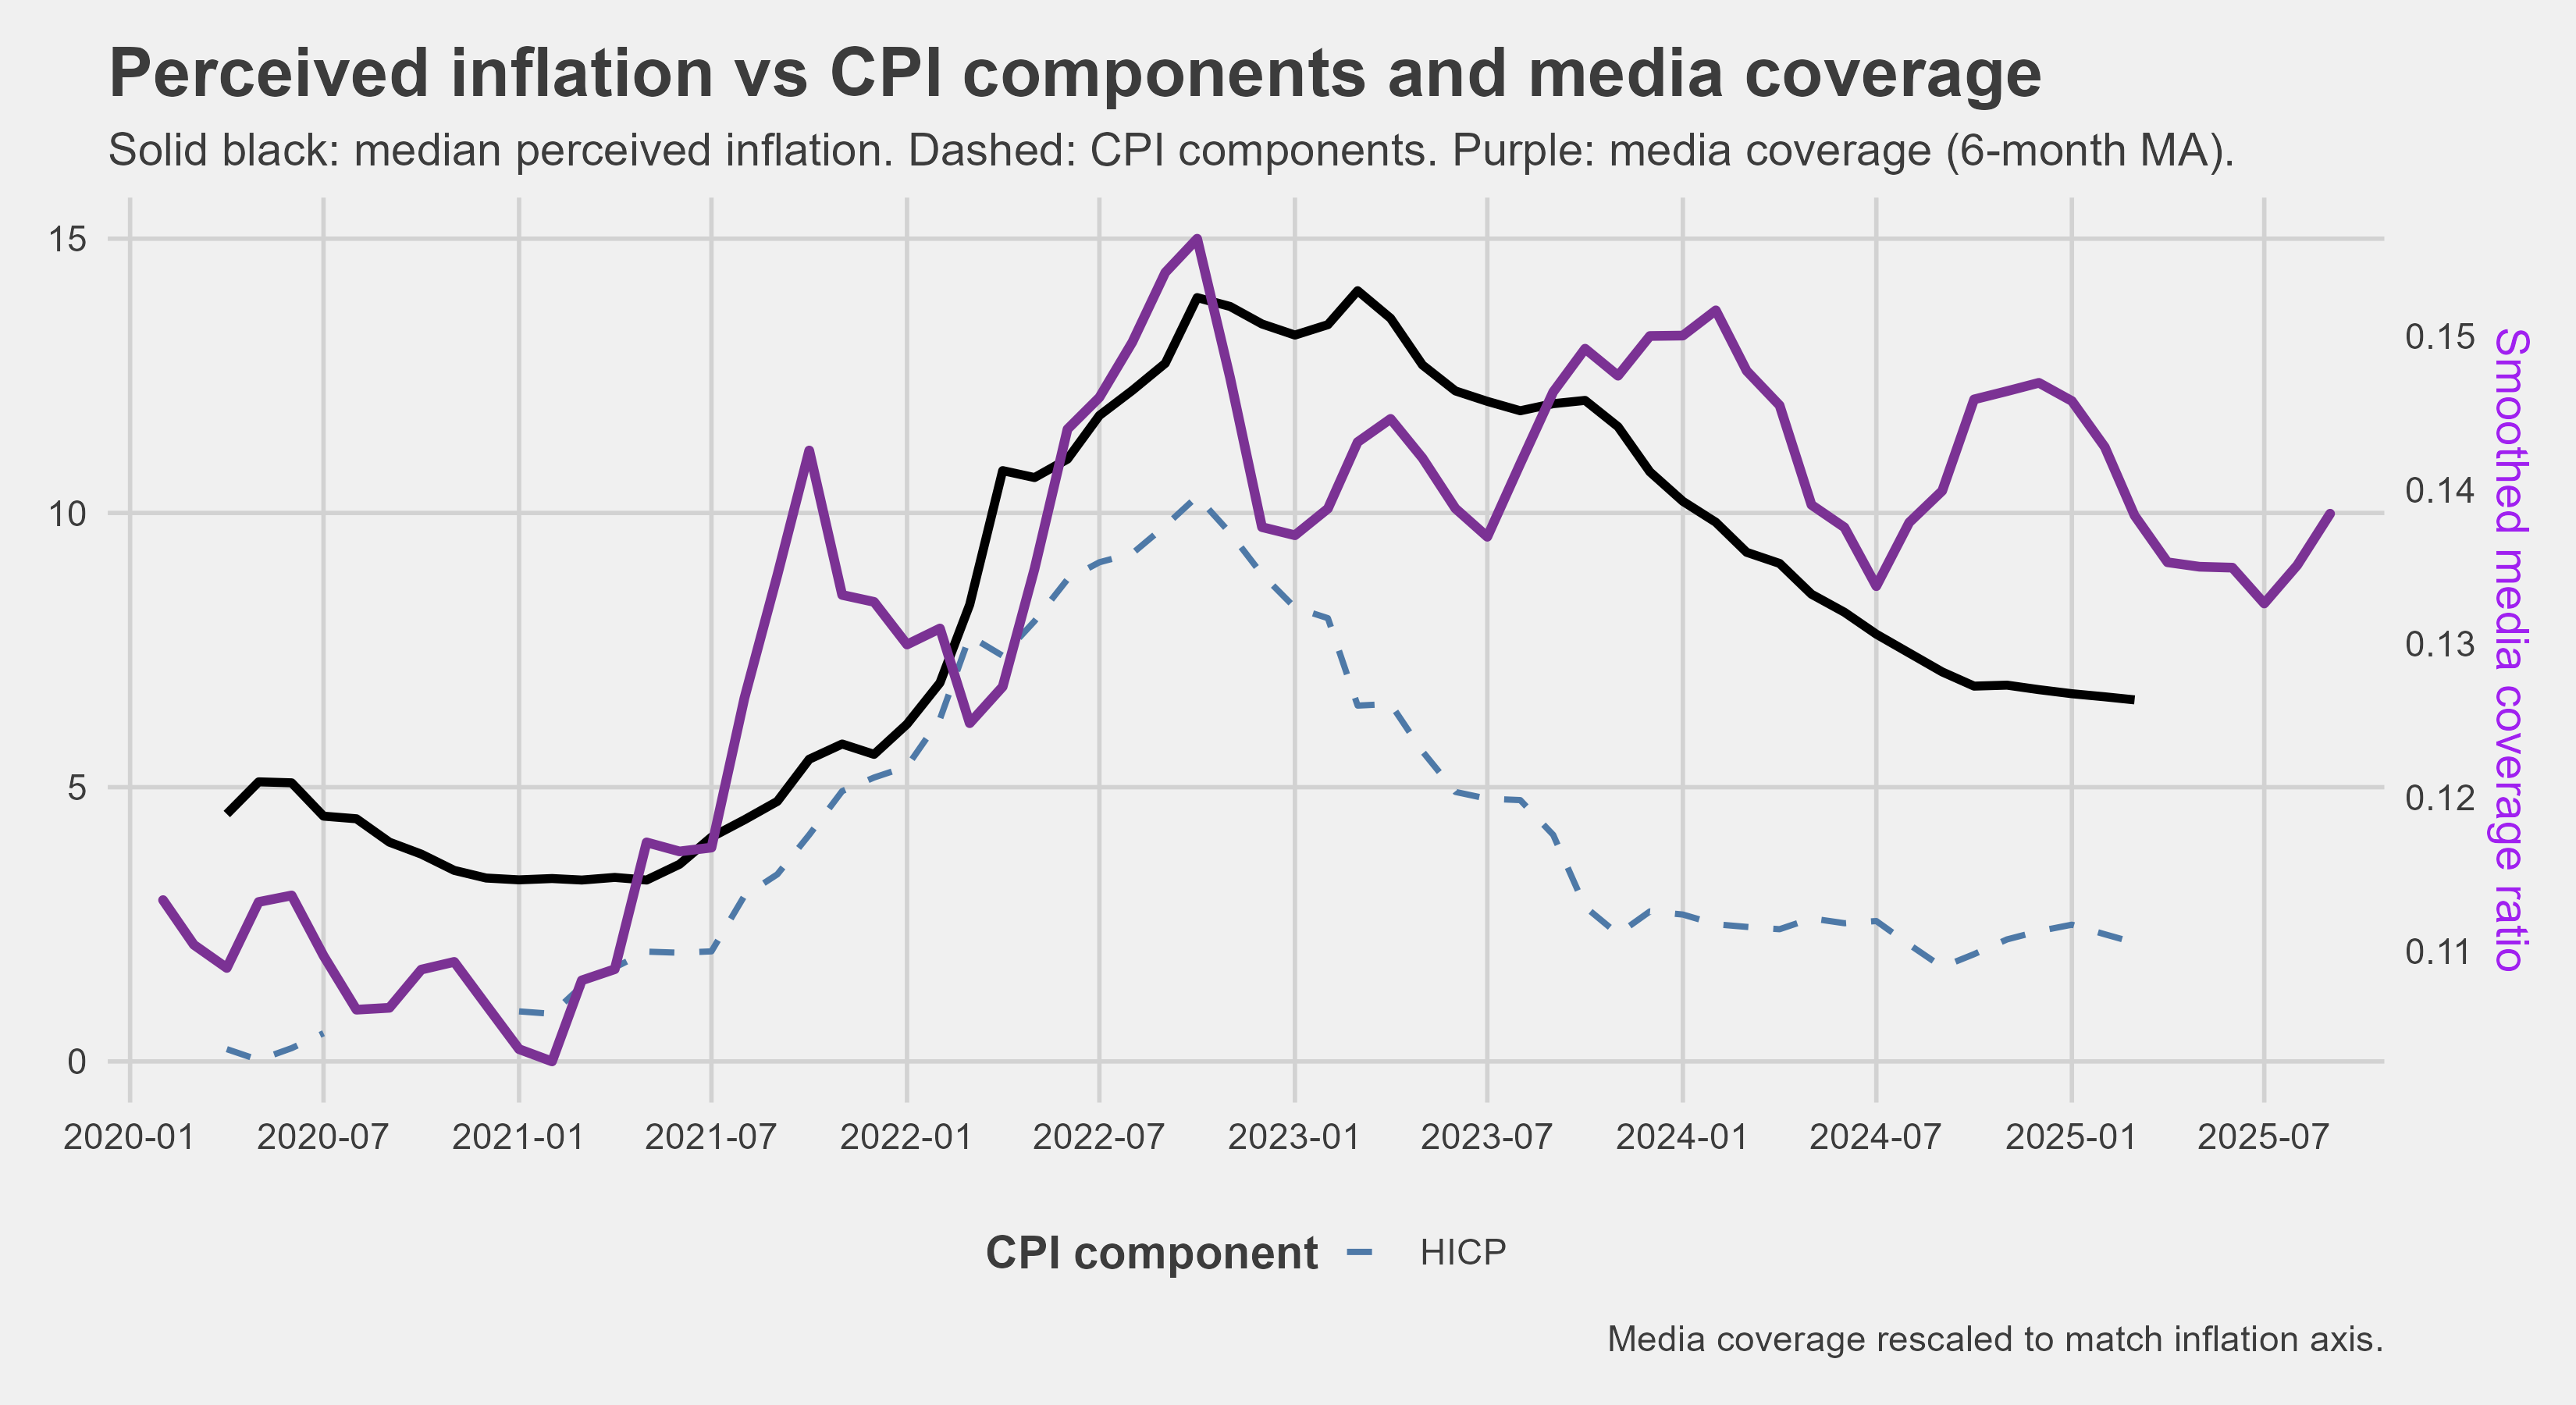
Just for fun I plotted this as well. It shows people’s overestimation of inflation in another way. The solid red line shows how inflation perception changes and the dashed blue one shows how actual HICP changes. Again showing peoples overestimation of inflation change.
The role of the media
I also considered how media portrayal of inflation affects things. This is a quick plot for now, but I will explore that in another article and go more in depth.
Thanks for reading. Hope you find it as interesting as I do. :)